Swiggy Data Analysis
Business Analytics Project
The Swiggy Sales Analysis project focuses on analyzing food delivery sales data to uncover customer preferences, sales performance, and restaurant trends. Using Power BI, the project transforms raw order data into interactive dashboards, enabling businesses to track KPIs such as order volume, revenue, delivery time, and customer satisfaction ratings.
Project Highlights
About the Project
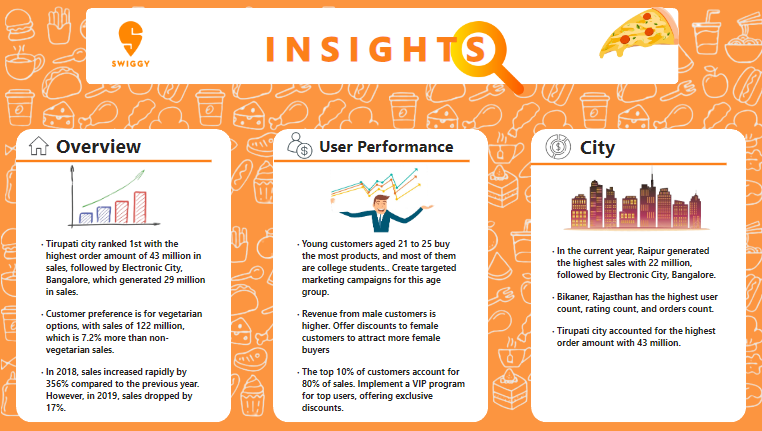
Overview
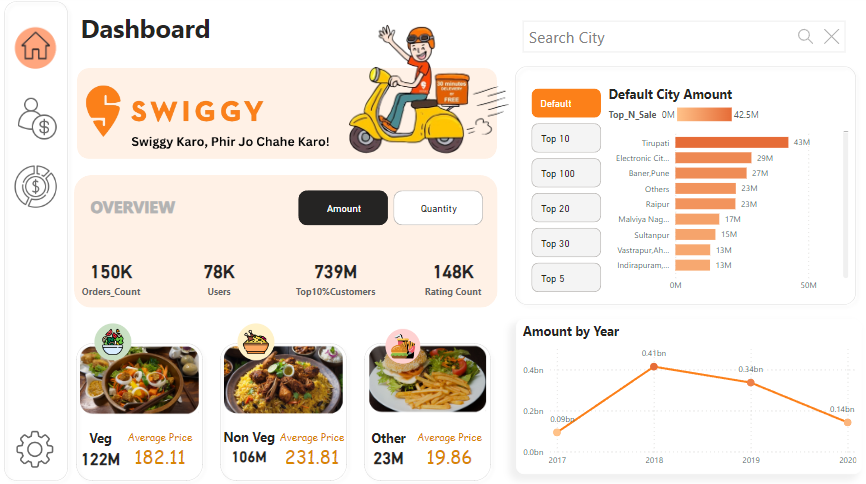
This Swiggy Sales Analysis project demonstrates how Power BI can transform raw food delivery order datasets into meaningful insights. The solution helps restaurants track sales KPIs, customer behavior, and delivery efficiency in real-time.
Key Insights
- 🍔 Top-selling dishes and restaurant categories
- 📊 Monthly revenue trends & peak ordering hours
- 🚚 Delivery performance metrics across partners
- ⭐ Restaurant ratings vs order volume
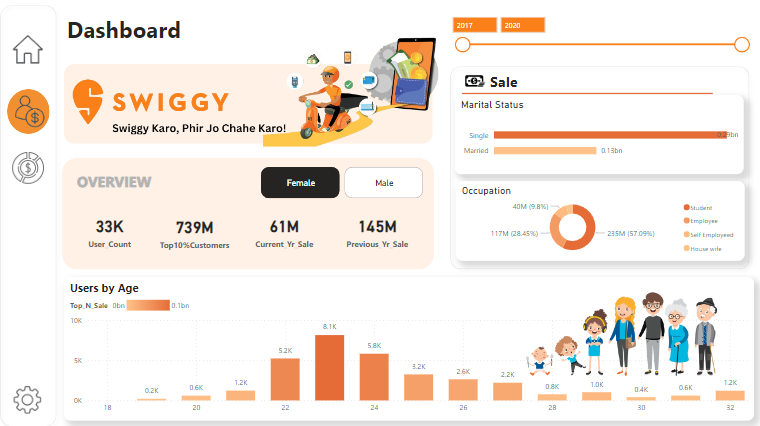
- 👥 Customer segmentation by order frequency & spend
The dashboards help Swiggy operations and partner restaurant teams make data-driven decisions to improve performance, optimize delivery efficiency, and enhance customer satisfaction.
Outcomes
- Interactive dashboards for management decision-making
- Insights to enhance customer ordering experience
- Optimized delivery operations and workforce planning across restaurants
By the end, the project demonstrated how data analytics can drive Swiggy’s operational efficiency and boost overall profitability.
When:
2025
Mode:
Power BI Dashboard
Dataset:
Swiggy Data
Focus:
Business Analytics
Project Snapshots
Business Impact
📈 Helped Swiggy identify peak order times and optimize delivery operations and restaurant coordination.
💡 Enhanced customer satisfaction by reducing delivery delays and improving the overall ordering experience.
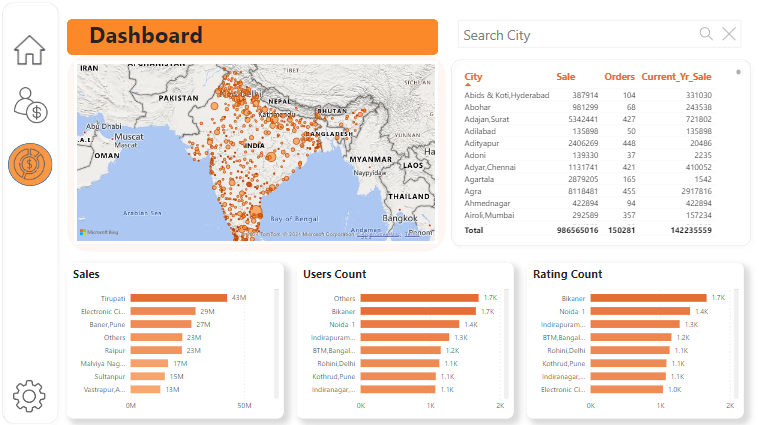
💰 Boosted revenue by highlighting top-selling dishes, high-performing restaurant partners, and popular delivery zones.
Challenges & Learnings
⚡ Cleaning and preparing raw Swiggy order data with missing, inconsistent, or unstructured entries.
📊 Designing dashboards that balance visual appeal, clarity, and real-time performance for diverse stakeholders.
🚀 Learned the importance of building scalable data models and dashboards for actionable insights across restaurants and delivery teams.